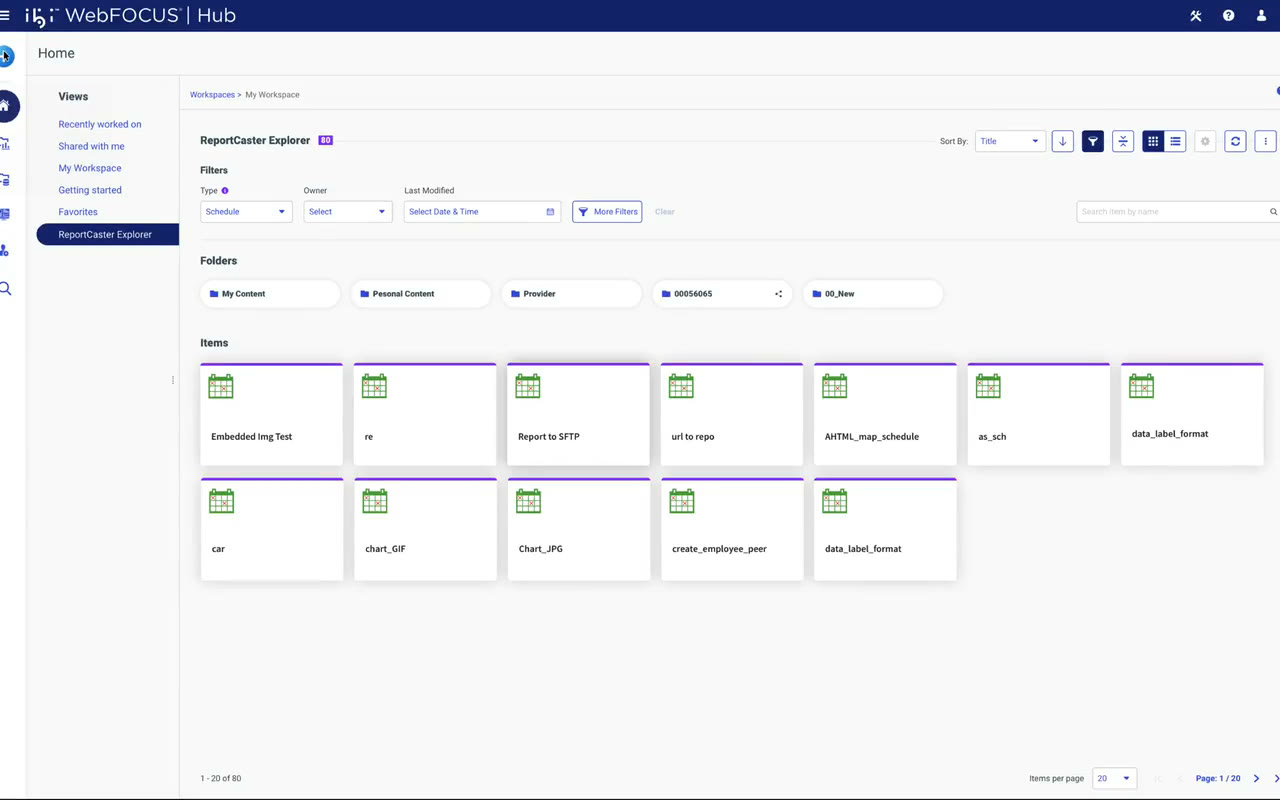
 ReportCasterScheduling and delivering reports, brought into one home.Live in every 9.3.x releaseCase study →
I make complex problems as obvious as a chair.
Tell me yours, and I'll build a working version in hours.
I'm Anuja, a senior product designer for AI and data products in B2B SaaS, 10 years in.
Open to senior and founding roles.
Selected work
ibi WebFOCUS · enterprise BI · 2022–2025
$175M P&L business unit. The platform, WebFOCUS, was named Best in Class by Dresner Advisory Services in 2025.
ReportCasterScheduling and delivering reports, brought into one home.Live in every 9.3.x releaseCase study →
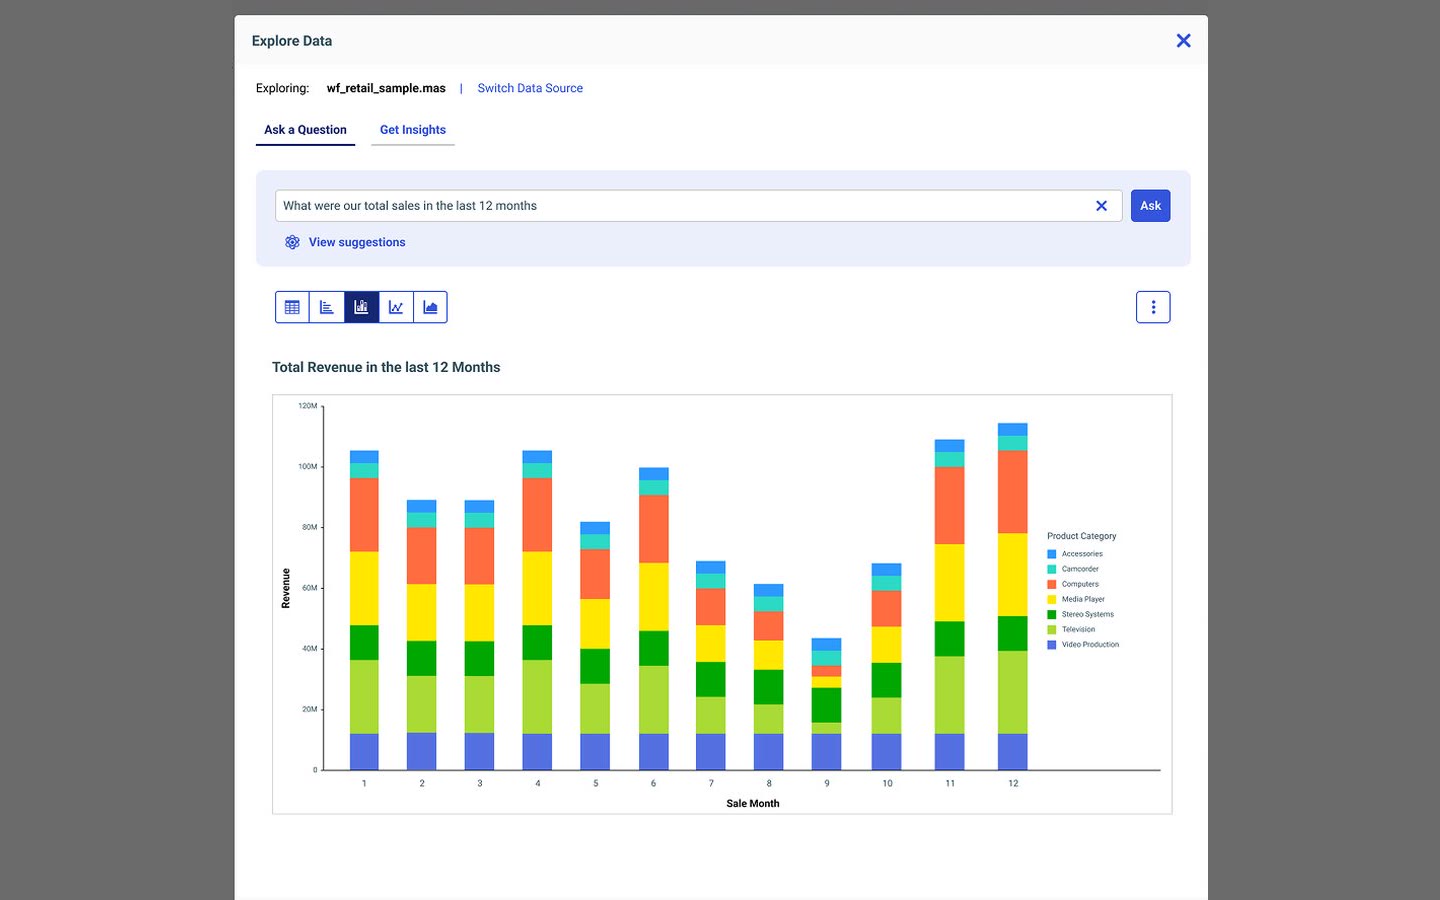 Explore DataAsk your data a question in plain English, with suggestions to start.Live in every 9.3.x releaseCase study →
Built by directing AI agents
Since December 2025 · each built from its own design system Design systems →
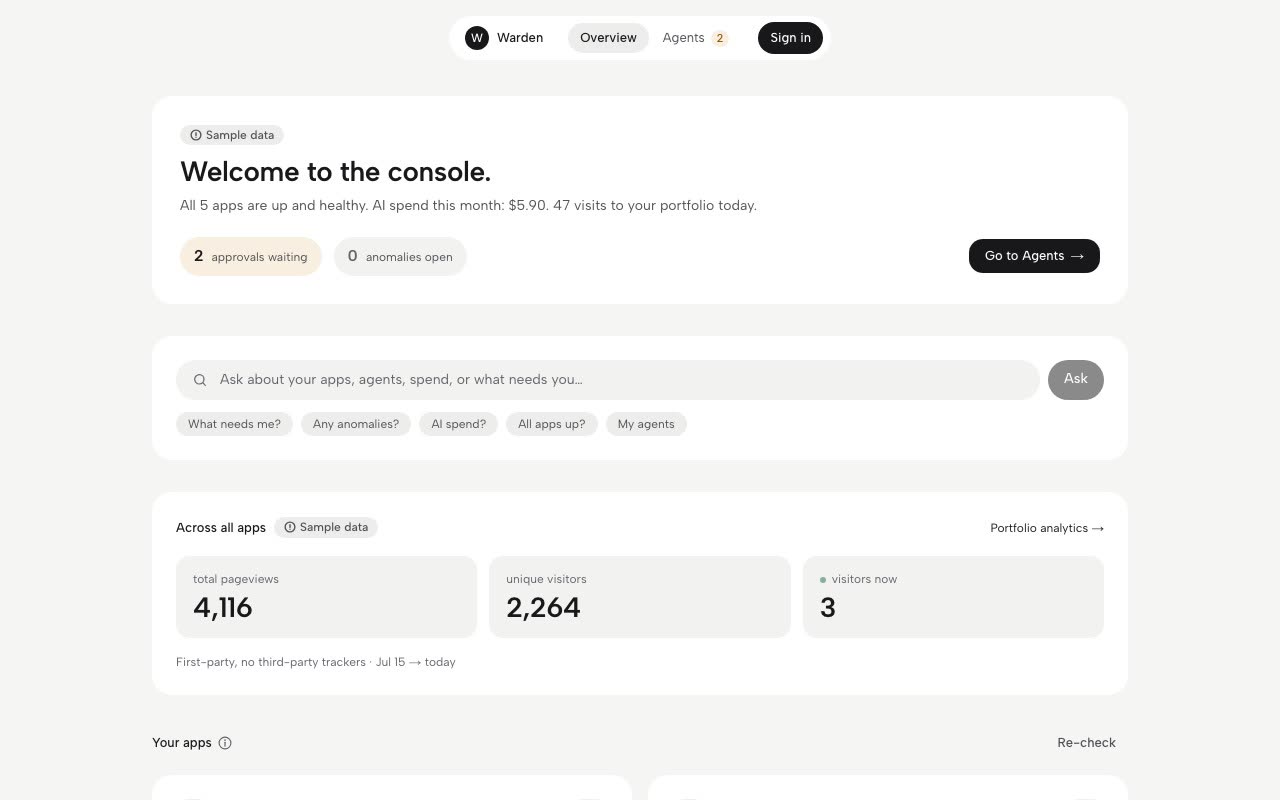 WardenDecides what AI agents may do. Pausing one actually stops it.Personal tool · live demo · 292 testsCase study →Demo ↗
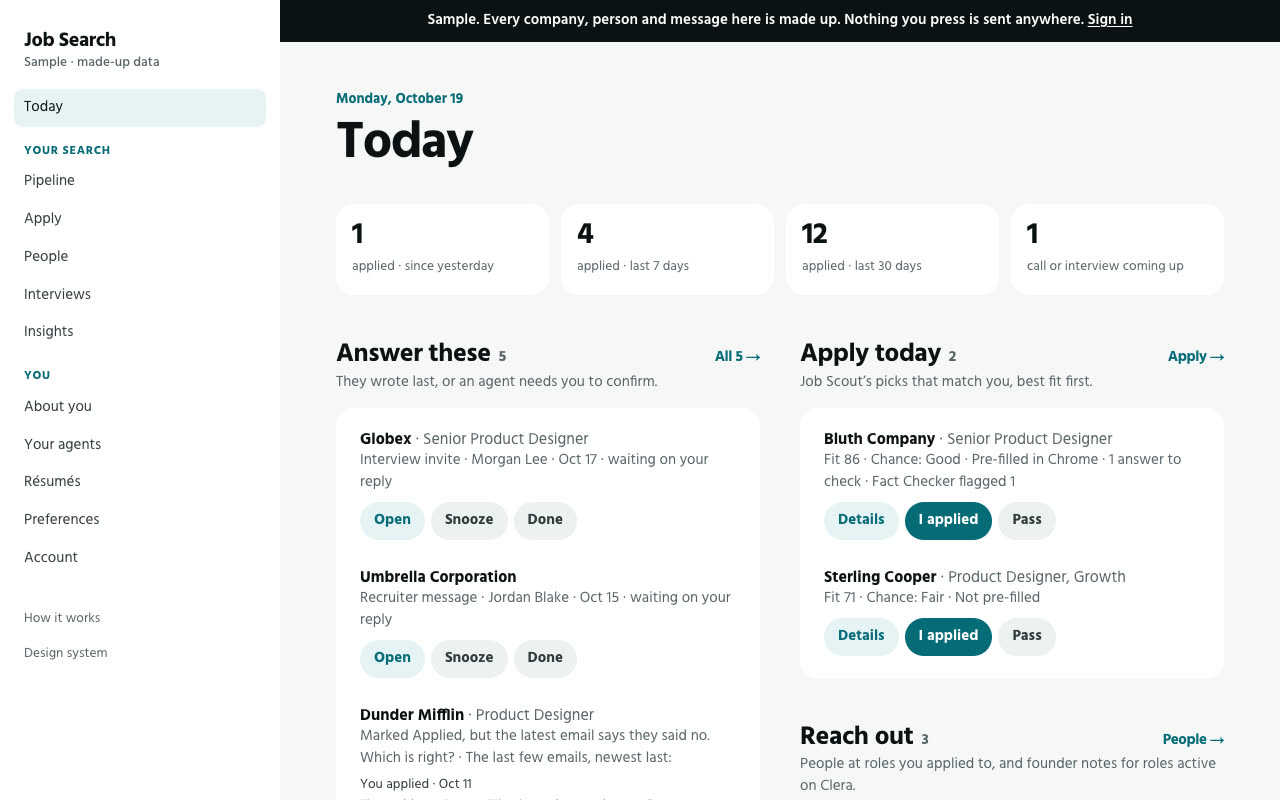 Job SearchTen AI agents run my job search. Nothing goes out without my yes.Personal tool · live demo · 263 testsCase study →Demo ↗
More work
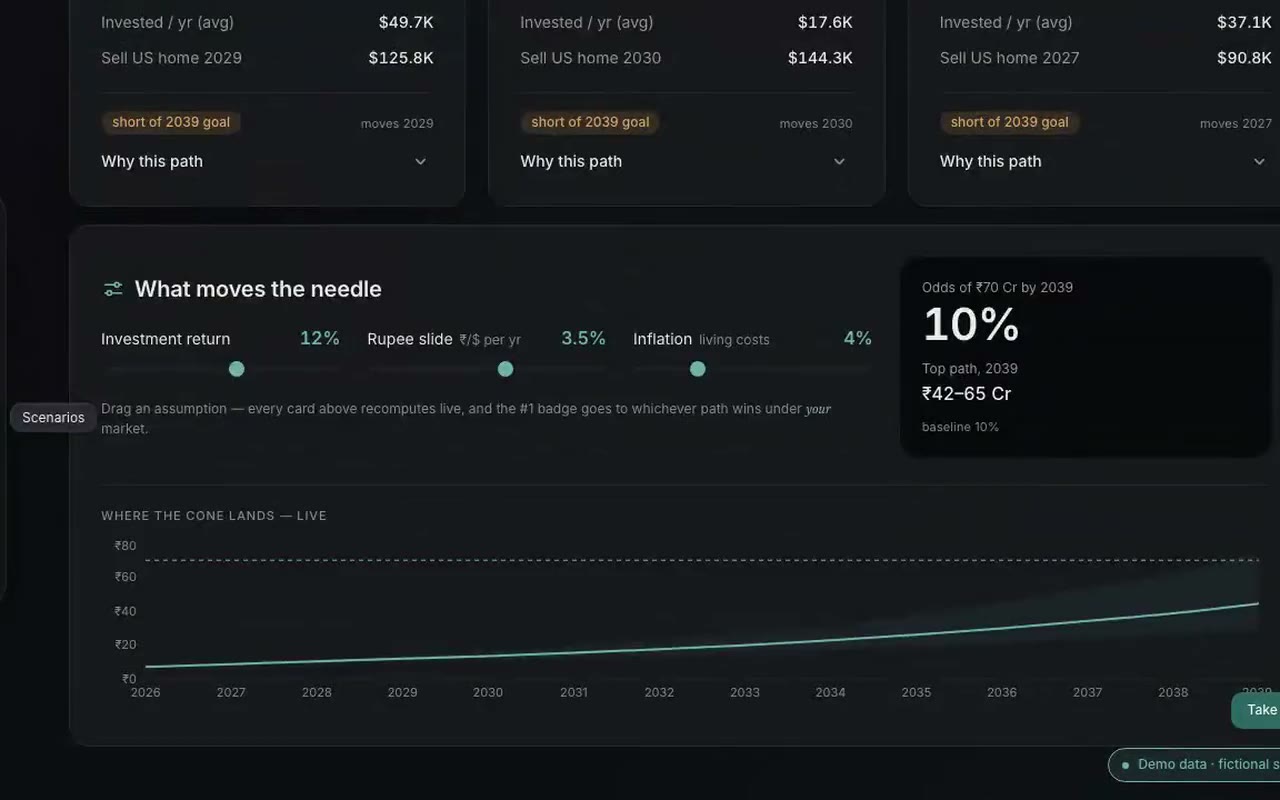 Finance ChiefMy personal CFO: I track my money and model big decisions in it.Personal tool · live demo · 1,271 testsCase study →Demo ↗
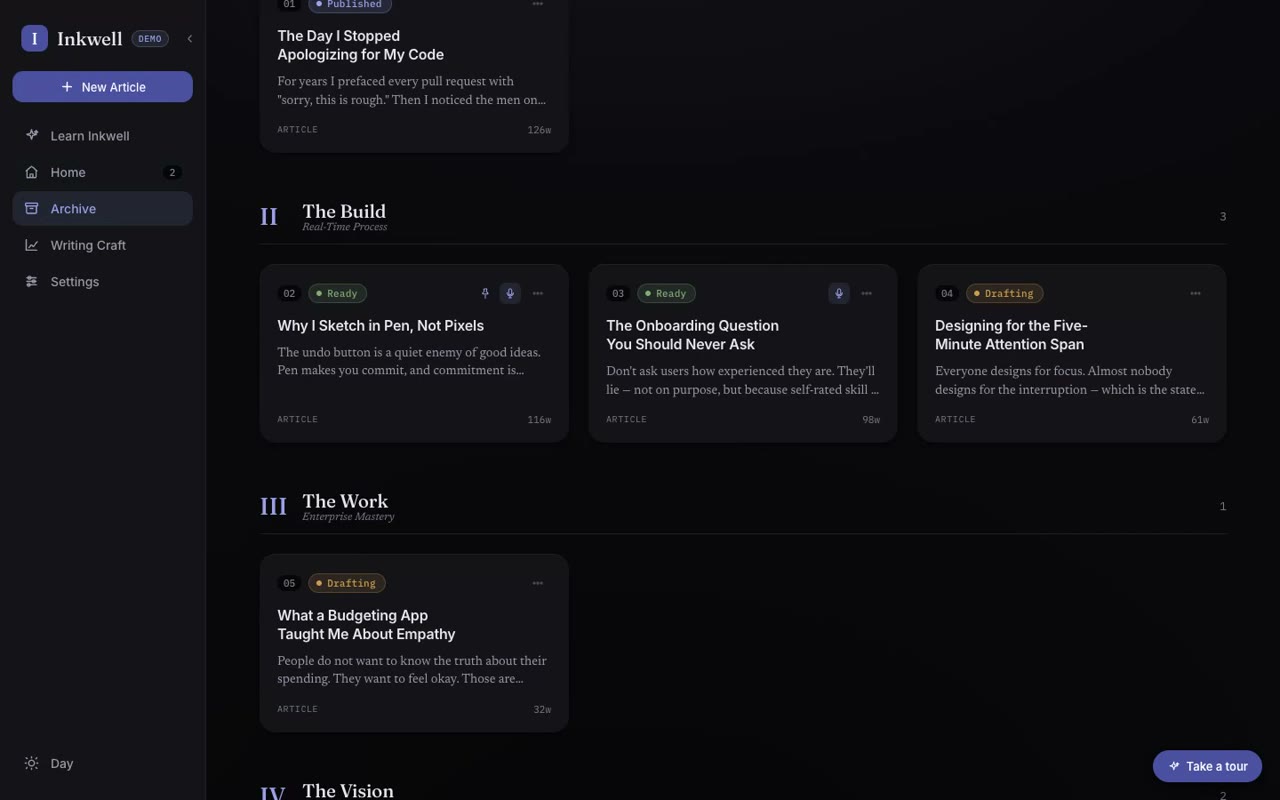 InkwellA writing studio with an archive, a publishing queue and a coach.Live app · 50 testsLive app ↗
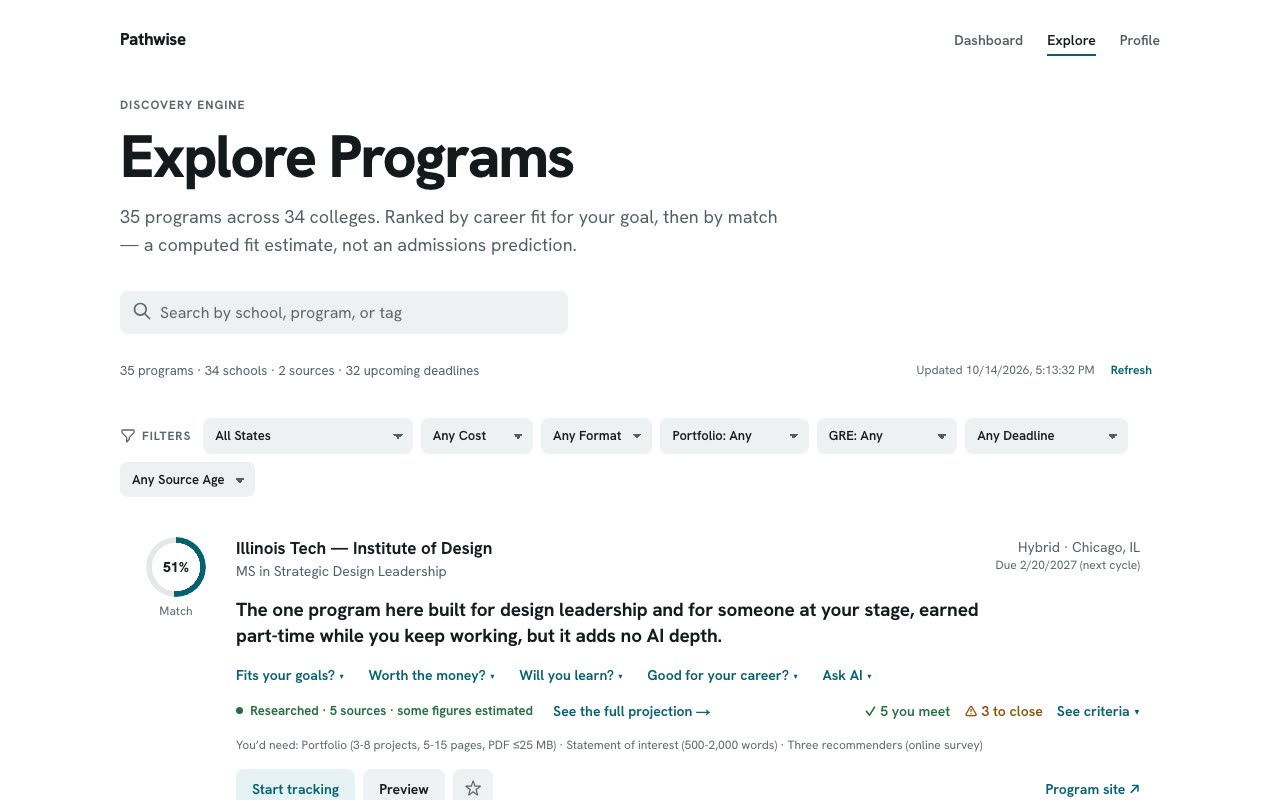 PathwiseEducation and career paths where every fact carries its source.Personal tool · live demo · 158 testsDemo ↗
Don't want to read case studies?Read a short visual story about each product →
Earlier work · 2012–2022
- WordU · Word game · 12K+ downloads in week one
- Kedazzle · 0-to-1 EdTech platform
- Travel Portal · B2B enterprise booking
- CRBS · Enterprise IoT interfaces
- Infinite · Productivity suite · mobile
- Suitcase · Travel planning app
- Pelli Choopulu · Matrimony app concept
- Graphic Design · Brand identity & print
A little bit about me
- Break it down.
- Assess it.
- Solve it.
- Keep refining.
“Before deciding what we’re going to put there, why don’t we clarify?”
ReportCaster had no documentation, so I sat with Support to watch people work around it and reverse-engineered the engine by hand.
“Design instincts don’t mean anything if you don’t have the evidence or logic to back it up.”
On ML Functions I tried three layouts before a popup won, and brought the veteran engineers along with evidence, not taste.
“When you look at a chair, the only thing that comes to mind is to sit on it.”
12 to 15 clicks became a guided four-step wizard. Four of four technical subject-matter experts then trained a model on their own.
“If we implement this right now, getting from this version to this version will be a breeze.”
ReportCaster’s delivery screen grew from five methods to eight without a redesign.
What leaders say
“She brings a rare combination of strategic thinking, design intuition, and the ability to work seamlessly across product, engineering, and business teams. Any team would be lucky to have her.”
“She approaches her work with a fearless attitude and is never afraid to explore new ideas or directions. Anuja is willing to take on difficult problems and push for creative solutions, even under tight timelines.”
“The clarity of her designs, in spite of the underlying data science and machine learning complexity, is impressive and has greatly contributed to the success of our products.”
“She impressed everyone with how quickly she grasped all aspects of a highly intricate system and translated it into a clear, modern, user-centered design. The kind of UX leader any team would be lucky to have.”
“Her design thinking workshops and prototype walkthroughs often became the foundation for key product decisions, driving clarity and alignment across cross-functional teams.”
“Anticipating the next move of the user, that is next level UI! Her design was clean, intuitive, and clearly addressed the needs of users across different skill levels.”
“Anuja demonstrated exceptional ability to understand intricate workflows and translate them into elegant, user-centric designs that elevated the product’s usability and visual appeal. An invaluable contributor to any design-led team.”
“Smart and very attuned to user needs, she ‘just gets it’ and developed intuitive designs that were very well received by our end users. Dedicated, thoughtful, and highly creative — she’d be an asset to any team.”
The auroras and the ocean have been my dream for as long as I can imagine. I grew up in the coastal city of Mumbai and lived in Boston for a couple of years. The sea and harbors have always been my space — I like spending hours just staring at it. It's my most precious dream as a designer to watch lights dancing in the night sky over the ocean. So I like to bring this side of my mind here, in my work. Seeing it on my site makes me feel alive, somehow.
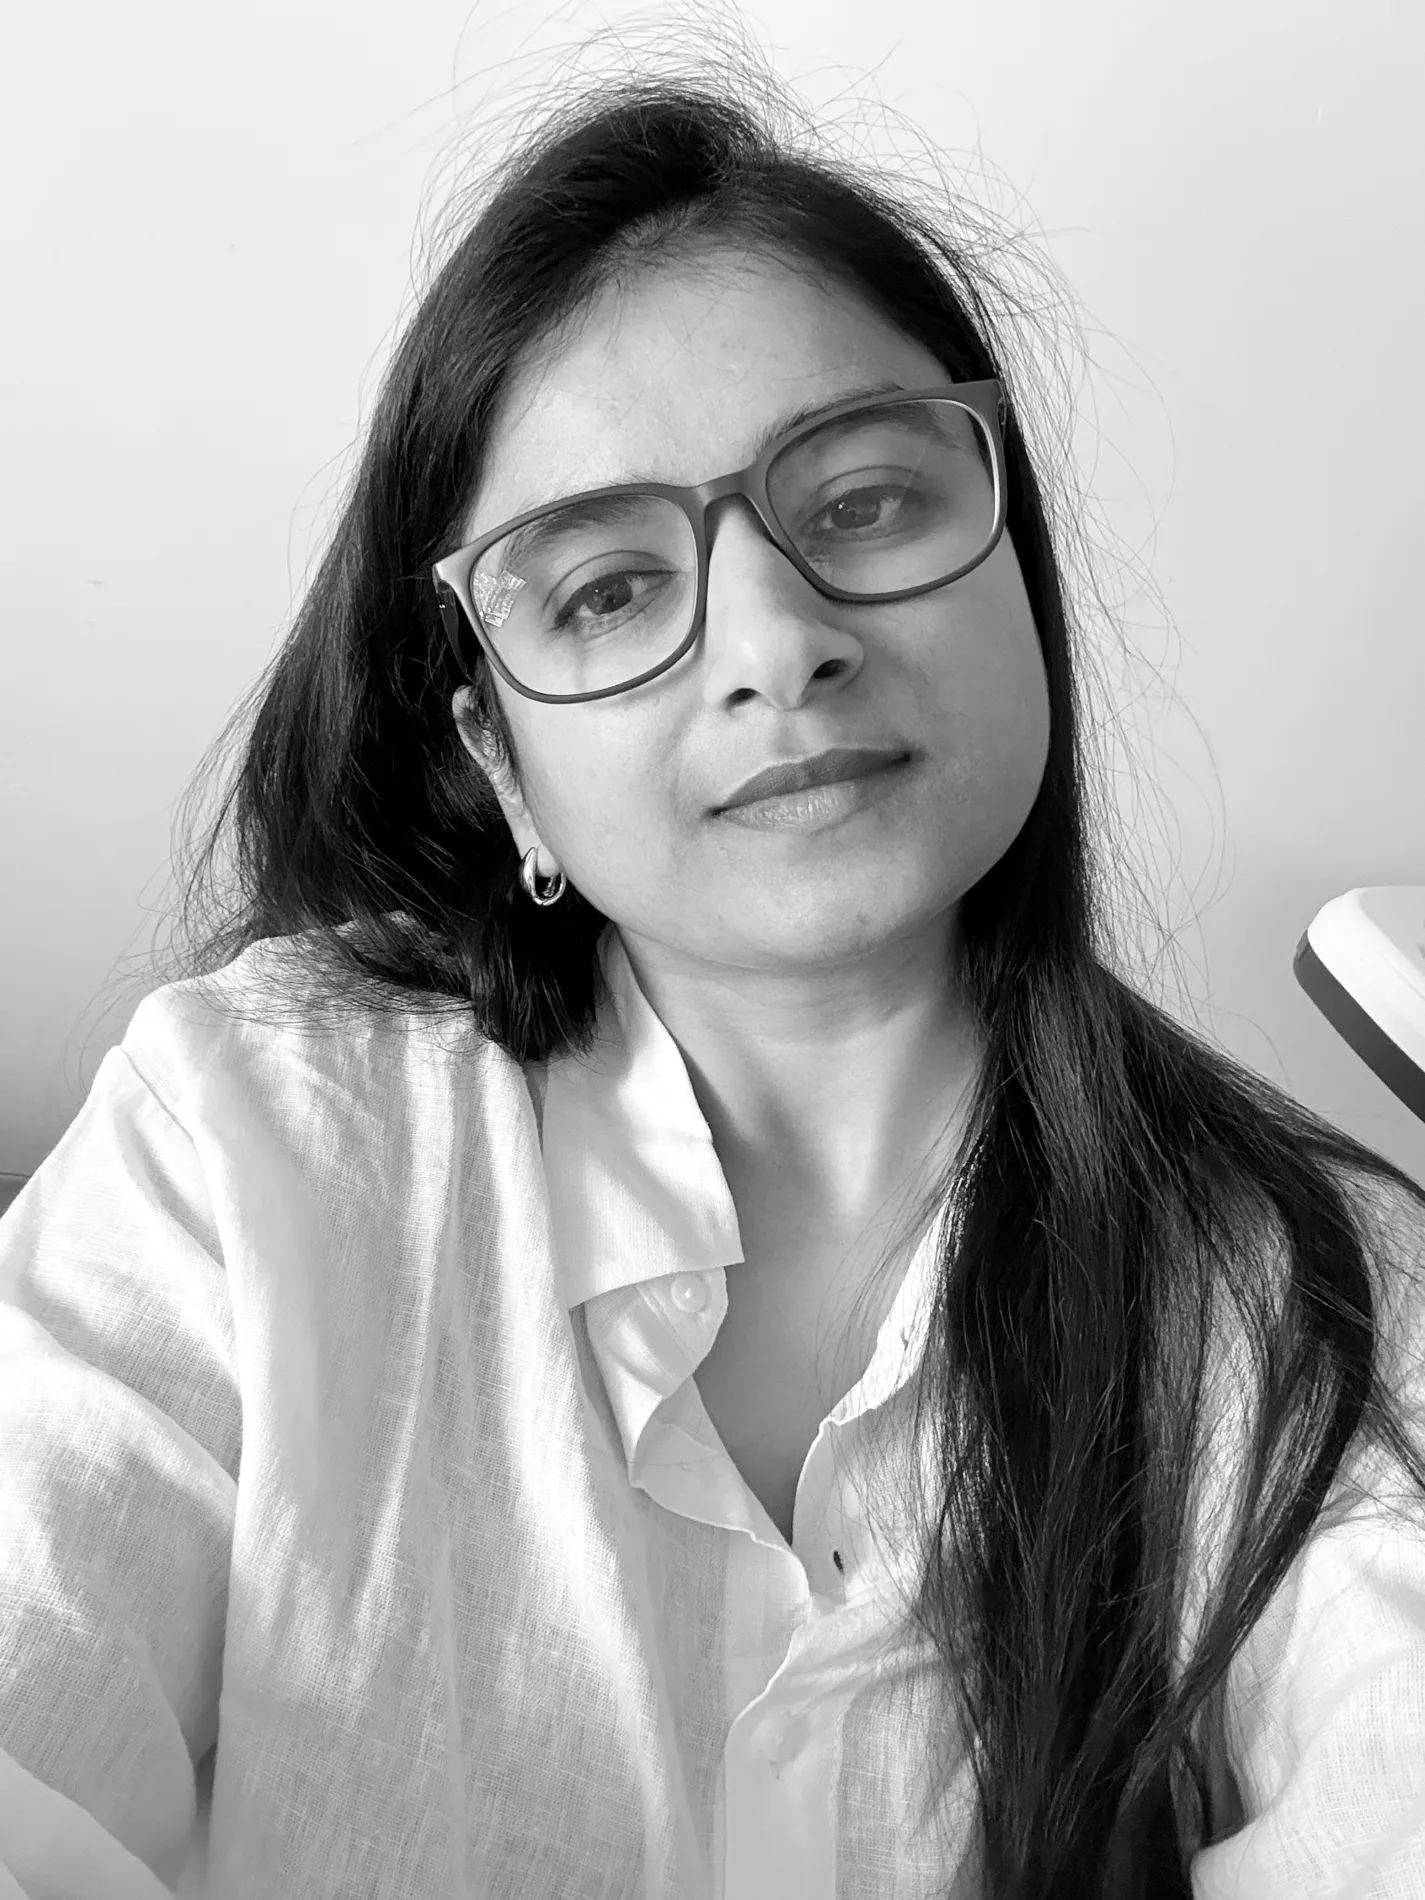
Parent
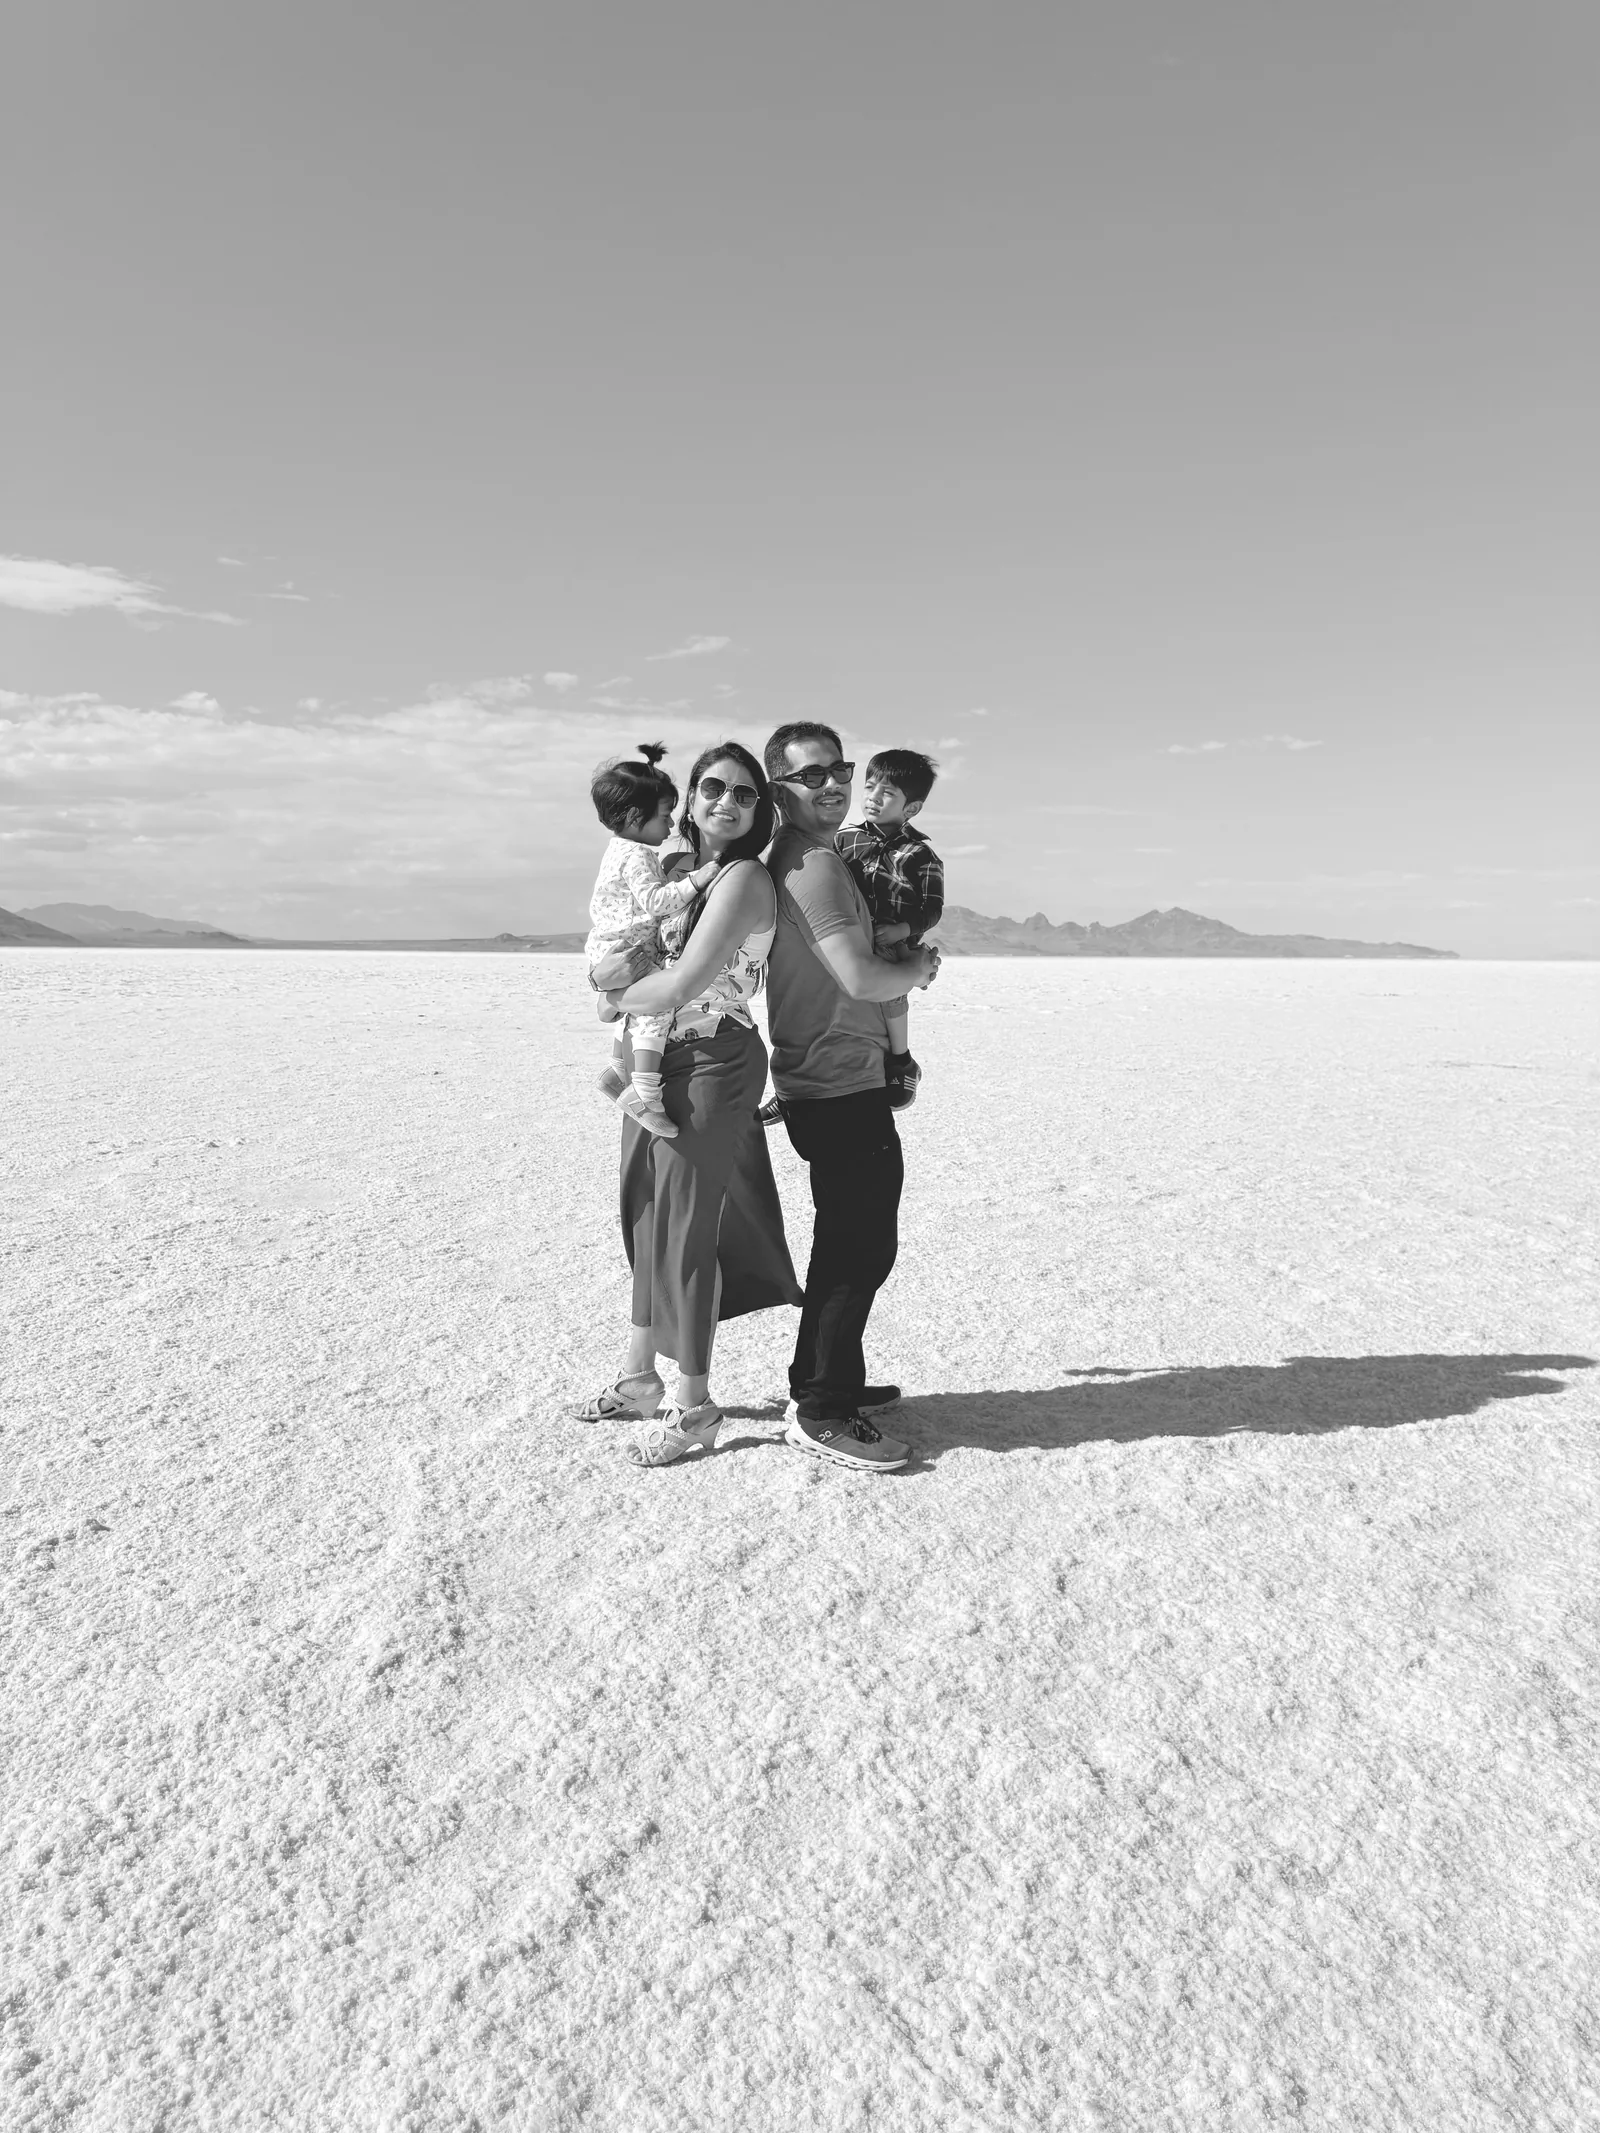
The family I built — with the man I've known for half my life and my beautiful children.
Baker
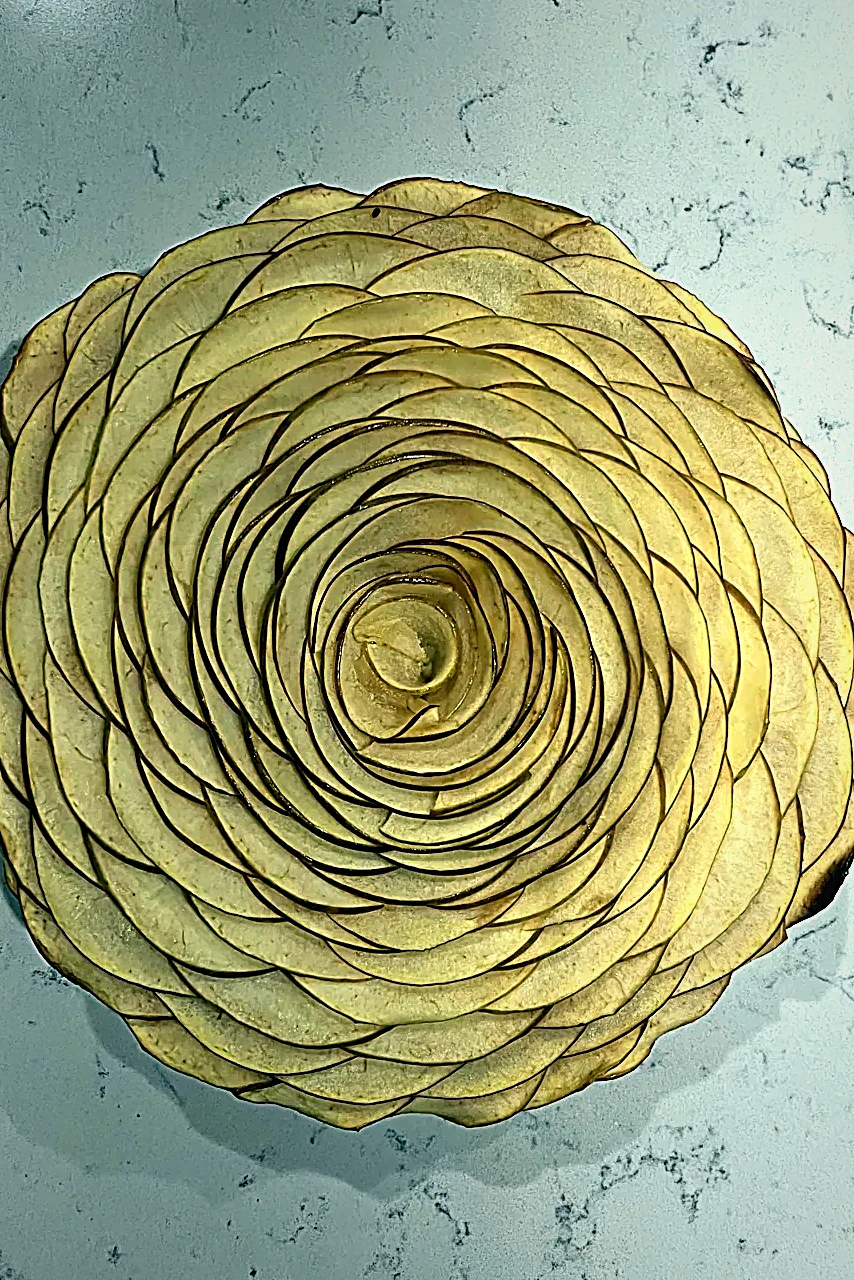
“What can I cook today that I haven't cooked before?”
The kitchen, on my mind site ↗Painter
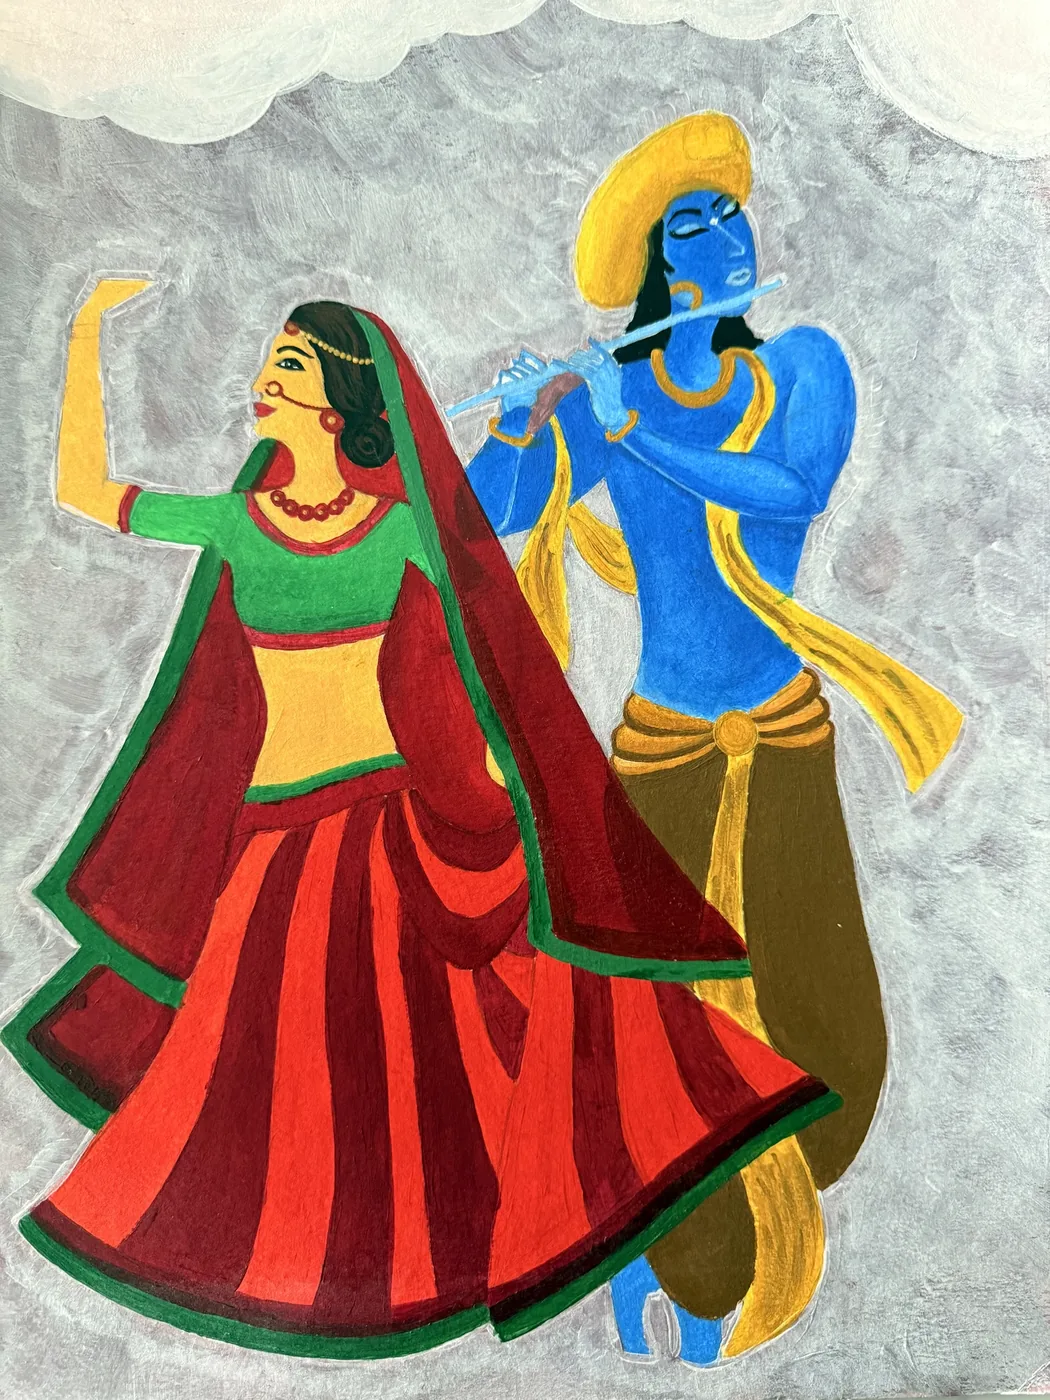
“I've always been a blank canvas — so I look for inspiration. Deities, flowers, a beautiful face.”
I paint on Sunday afternoons.
The paintings, on my mind site ↗Poet
Where everything and everyone is just temporary
I see what helps me treasure the evanescent,
Life gave me the gift of art;
To be able to express myself.From “Gifts from Life”
I write when I feel like I need to write.
The poems, on my mind site ↗Writer
I write about design, AI and my career.
Everything I've written, on Medium ↗Migrant
Mumbai, Hyderabad, Boston, and so many other cities.
In the US since 2017.
I can make a stranger my friend in 30 minutes.
Step inside my mind
I make things — with my hands, with words, with heat, with code — and I honestly can't stop. It's closer to a compulsion.
Step inside my mindMy art, poems, kitchen and the rest live on mind.anujaharsha.com.
Let's talk.
Open to senior and founding product designer roles. Authorized to work in the US without needing sponsorship.